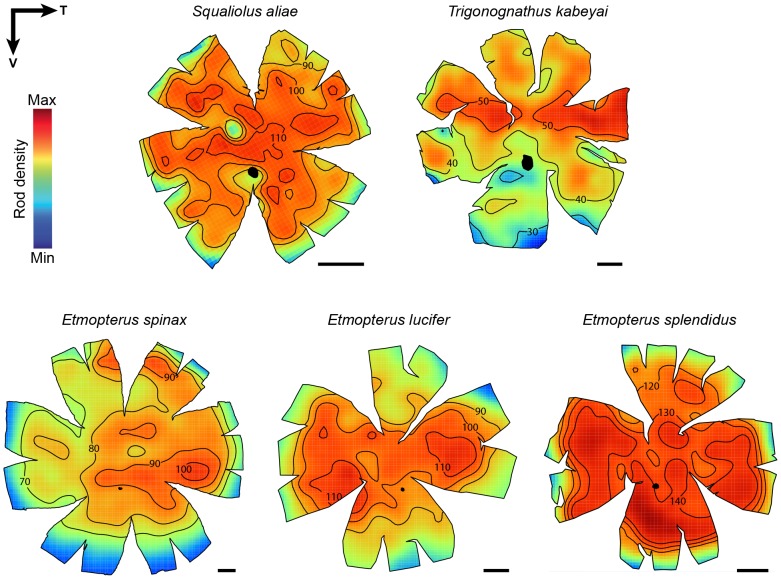
Figure 3. Topographic maps of photoreceptor densities.
Black arrows indicate retina orientation (T = temporal, V = ventral). For comparative purpose, T. kabeyai retina (which comes from a left eye contrary to the other retinas) was vertically mirrored. Isodensity lines were arbitrarily selected in order to highlight the specialisations. All the densities are ×103 cells mm−2. Scale bars, 2 mm. mm.

