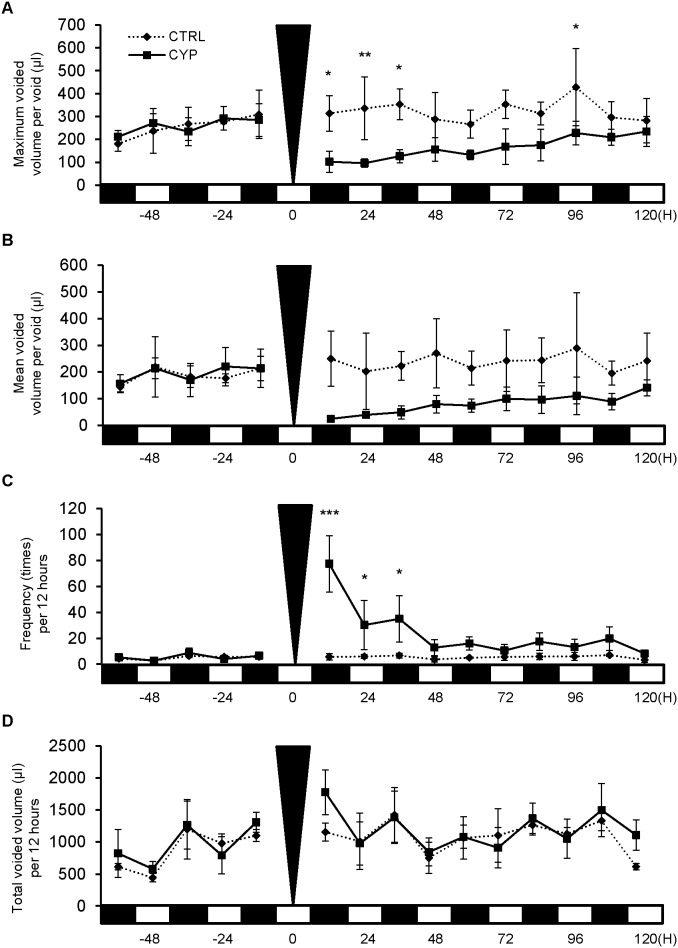
Figure 1. Voiding behavior of mice with cystitis.
Micturition patterns were analyzed in the CYP-induced cystitis group (CYP; n = 3) and the sham-treated control group (CTRL; n = 4) with the aVSOP method. A: Maximum voided volume per void. The CYP group demonstrated a significant decrease in volume at 12, 24, 36 and 96 hours when compared to the control group. B: Mean voided volume per void. The CYP group demonstrated a decrease in volume. C: Urinary frequency per 12 hours. The CYP group displayed a significant increase in frequency at 12, 24 and 36 hours. D: Total urine volume per 12 hours. There was no change in both groups. The black triangle shows the time of CYP administration. On the X-axis, the black squares indicate dark periods (9∶00 pm to 9∶00 am) and the white squares indicate light periods (9∶00 am to 9∶00 pm). Two way repeated measure ANOVA and Bonferroni post-test were performed and P<0.05 was regarded as significant. *P<0.05, **P<0.01, ***P<0.001.

