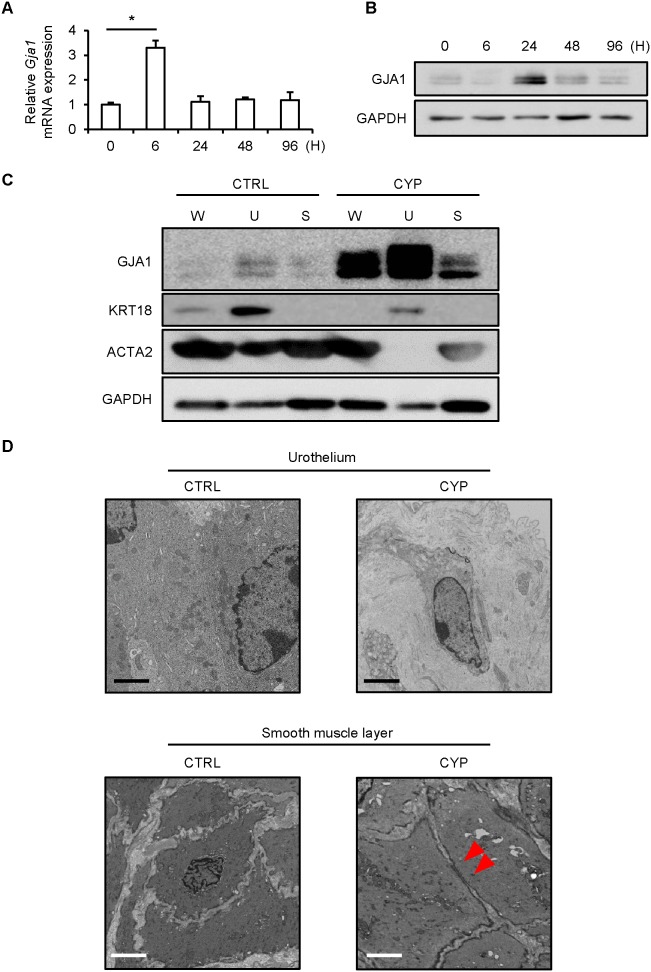
Figure 3. GJA1 expression and gap junction formation in the bladders of mice with cystitis.
A: qPCR revealed significantly elevated expression of Gja1 mRNA in the whole bladder at 6 hours after treatment (n = 4). Dunnett's multiple comparison test was performed. P<0.05 was regarded as statistically significant; *P<0.05. B: Immunoblotting data revealed up-regulation of GJA1 protein in the whole bladder at 24 hours after treatment (n = 3). The representative data shown were consistently replicated in other experiments. C: Immunoblotting data revealed that GJA1 expression was stronger in the urothelium with suburothelium (U) than in the smooth muscle layer (S) in the CYP-induced cystitis group (n = 3). The representative data shown were consistently replicated in other experiments. W: the whole bladder. D: TEM study revealed that urothelial cells were attached with each other in the sham-treated control group (CTRL; n = 3) but disconnected in the CYP-induced cystitis group (CYP; n = 3). Gap junctions were not observed in either group. In contrast, gap junctions were not found in the smooth muscle layer of the CTRL group but appeared in that of the CYP group. The representative data shown were consistently replicated in other experiments. Red arrow heads indicate gap junction. Scale bars indicate 2 µm.

