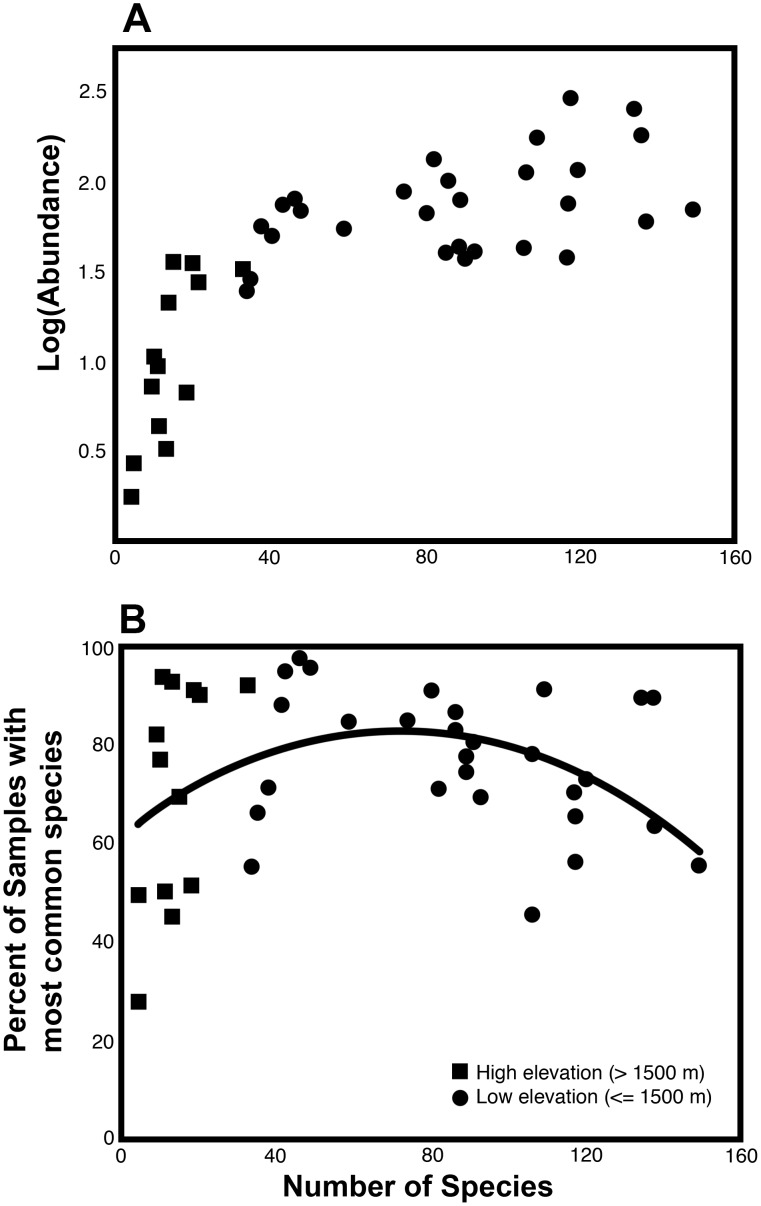
Figure 3. Ant abundance variables as a function of species richness among 41 Central American wet forest sites.
Number of Species = number in 100 samples (taxon subset; see text). Symbols differentiate low and high elevation sites (elevation rounded to nearest 100 m). A. Log(Abundance) = average of 100 log[n+1] values where n = number of workers in 1 m2. B. Percent of samples containing the single most abundant species at each site. The curve shows the fitted quadratic model.

