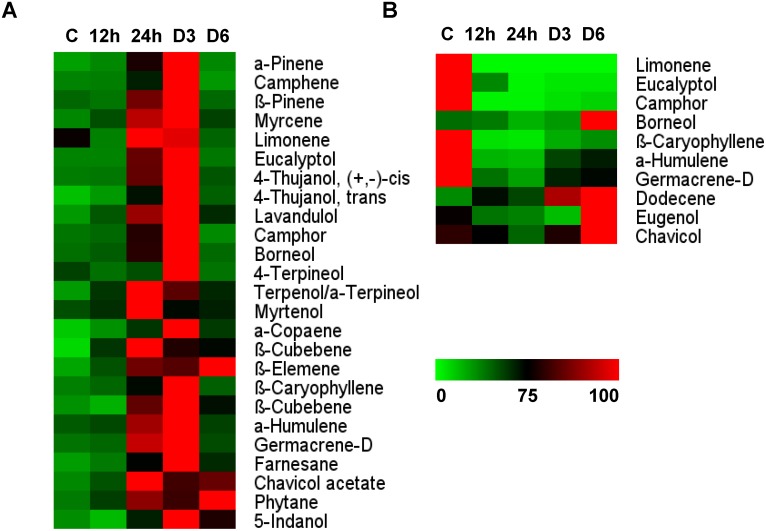
Figure 4. Metabolic changes in stems and roots of O. kilimandscharicum following H. armigera infestation.
Heat map representing relative expression of a sub-set of volatiles elicited in A. stems and B. roots during O. kilimandscharicum- H. armigera interaction at 12 h, 24 h, and on days 3 (D3) and 6 (D6) as compared to control (C) plants.

