
Figure 1.
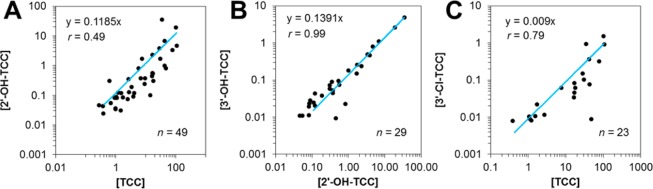
Correlation analysis of the urinary total (∑-) concentrations of (A) TCC with its human phase-I metabolite, 2′-OH-TCC, and (B) the two phase-I metabolites, 2′-OH-TCC and 3′-OH-TCC, as well as (C) TCC with its manufacturing byproduct (3′-Cl-TCC). All concentrations are expressed in units of μg/L.