
Figure 4.
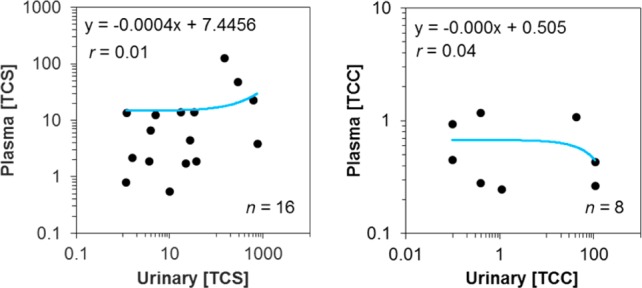
Correlation analysis of measured total (∑-) concentrations of TCS (n = 16) and TCC (n = 8) in maternal urine and cord blood plasma sampled between 6 and 9 months and at birth, respectively. Data were plotted only when the analytes were detected in both matrices from a study subject. All concentrations are expressed in units of μg/L.