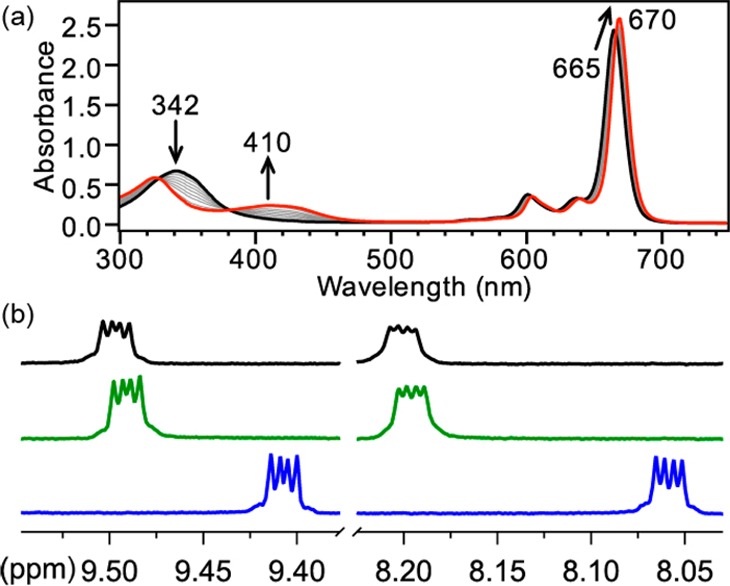
Figure 1.

(a) UV–vis titration of ZnPc (6.3 μM in THF, black) with NaSH (0.25 equiv increments of 8 mM NaSH in DMSO up to 5 equiv). (b) 1H NMR (600 MHz, THF-d8) spectra of 600 μM ZnPc (top, black), 600 μM ZnPc with 2 equiv of KOH in DMSO-d6 (middle, green), and 600 μM ZnPc with 2 equiv of NaSH in DMSO-d6 (bottom, blue).
