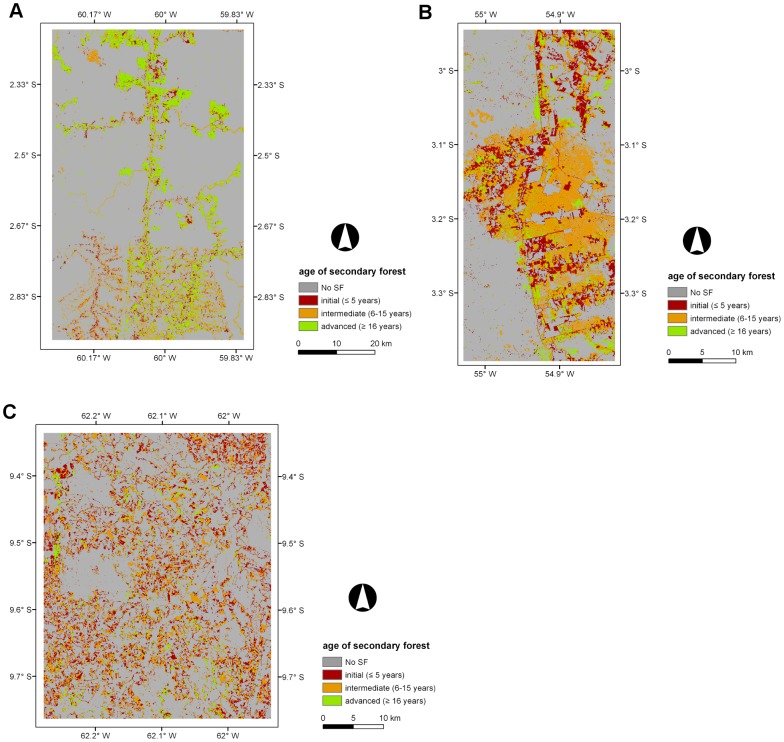
Figure 3. Maps displaying the age of secondary forest (ASF, years) across the three selected sites.
Maps displaying the age of secondary forest (ASF) across the three selected sites for areas undergoing secondary forest (SF) in the last year of the corresponding time-series; A) Manaus (2011), B) Santarém (2010), and C) Machadinho d’Oeste (2011).

