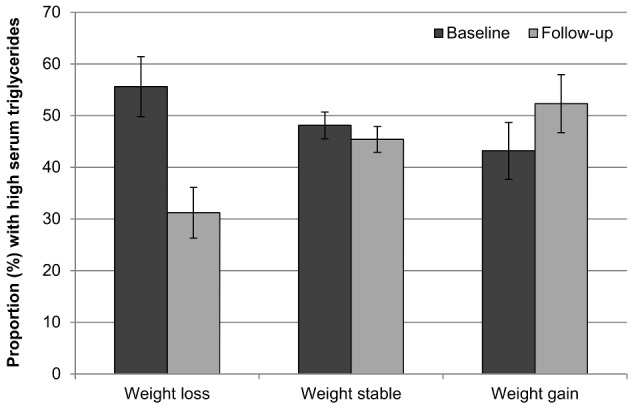
Figure 5. Prevalence of high serum triglycerides at baseline and follow-up by weight change status.

Values are mutually adjusted for age, sex, wealth, and weight loss intention. Error bars represent the 95% confidence interval.

Values are mutually adjusted for age, sex, wealth, and weight loss intention. Error bars represent the 95% confidence interval.