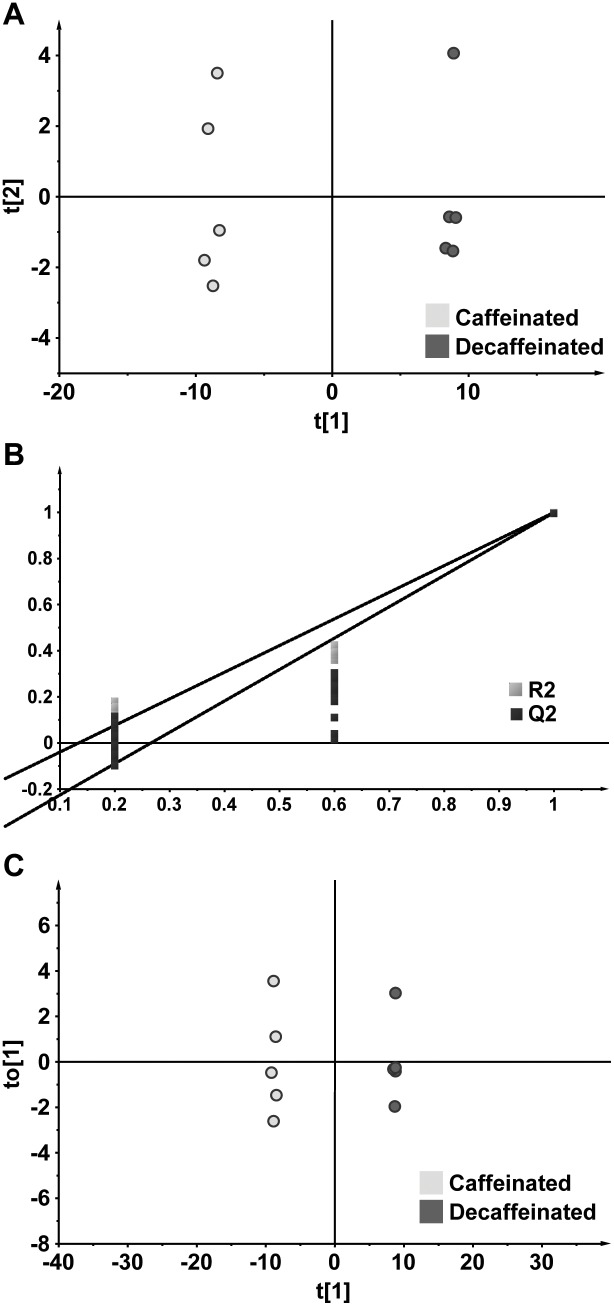
Figure 2. Multivariate data analysis of metabolites in the caffeinated and decaffeinated coffee samples.
Panel A shows the PCA scores plot for caffeinated and decaffeinated coffee samples, panel B displays the model validation plot for PLS-DA model between caffeinated and decaffeinated coffee samples, and panel C illustrates the OPLS-DA model between caffeinated and decaffeinated coffee samples (1 predictive component, 1 orthogonal component, R2(Y) = 1, Q2(cum) = 0.998).

