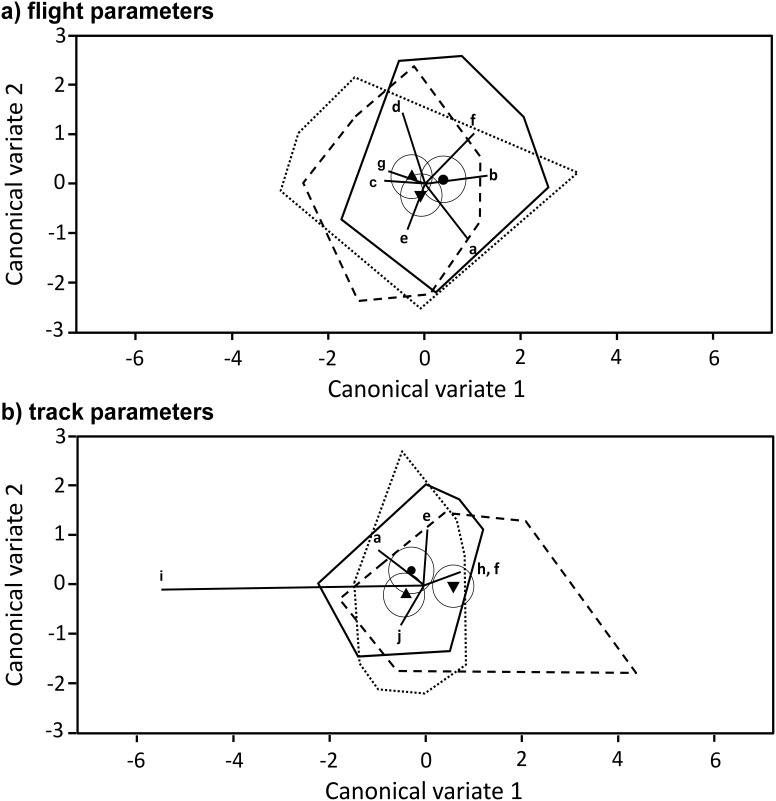
Figure 6. Comparison of flight performance.
Biplots of a Canonical Variate Analysis (CVA) of a) normalized and standardized flight parameters (a: max. acceleration, b: mean acceleration, c: max. velocity, d: mean velocity, e: mean gap duration, f: total gap-duration, g: straightness) and b) normalized and standardized track parameters (h: actual total flight-time, i: Approachiness, j: total track duration, k: track length, f: total gap duration, e: mean gap duration; h and f coincident). Treatment mean scores+95% C.I. (solid circles) and circumferential polygons are given as follows: sucrose-control CS: ▴, dotted line; gut-extract control CGE: •, solid line; Nosema-inoculated Nc: ▾, dashed line. Both graphs show a low discriminative power of both types of parameter in separating Nosema-infected and uninfected bees, with only Approachiness (i), highly affected by homing success, allowing some separation of the infected non-returning bees from the rest.

