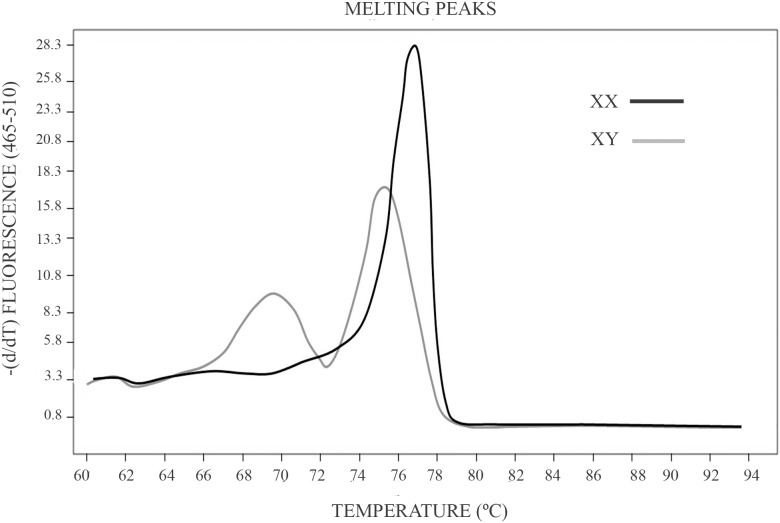
Figure 1. Melting temperature curve profiles produced by male and female samples in a HRM analysis.
HRM analysis starts with a PCR amplification of the amelogenin gen. The amplification is in the presence of EvaGreen a saturating dye which presents high fluorescence when bound to dsDNA. Amplification is followed by a High Resolution Melting analysis (HRM) in the LightCycler 480 Real-Time PCR Instrument (Roche Applied Science). A dissociation curve analysis displays the different melting temperature of products from the X and Y chromosome.

