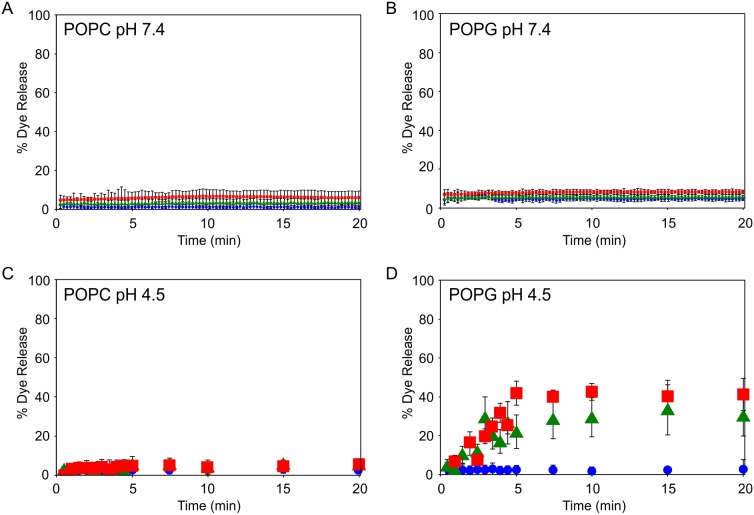
Figure 2. Dye release upon addition of β2m to POPC/cholesterol or POPG/cholesterol LUVs.
Dye release from LUVs (5 µM lipid) comprising of (A) 75 mol % POPC: 25 mol % cholesterol and (B) 75 mol % POPG: 25 mol % cholesterol measured continuously over 20 min following addition of 6 µM β2m samples in Buffer A at pH 7.4, 37°C. Error bars represent 1 standard deviation (S.D.) from three replicates for each β2m species. Dye release from LUVs (5 µM lipid) comprising (C) 75 mol % POPC: 25 mol % cholesterol and (D) 75 mol % POPG: 25 mol % cholesterol measured discontinuously over 20 min following addition of 6 µM β2m samples in Buffer B at pH 4.5, 37°C. Error bars represent 1 S.D. from three replicates for each β2m species at each time point. β2m monomer (circle, blue), fragmented fibrils (square, red) and unfragmented fibrils (triangle, green).

