
Figure 5. Change in tryptophan fluorescence quenching for β2m in the presence of LUVs. Δ.
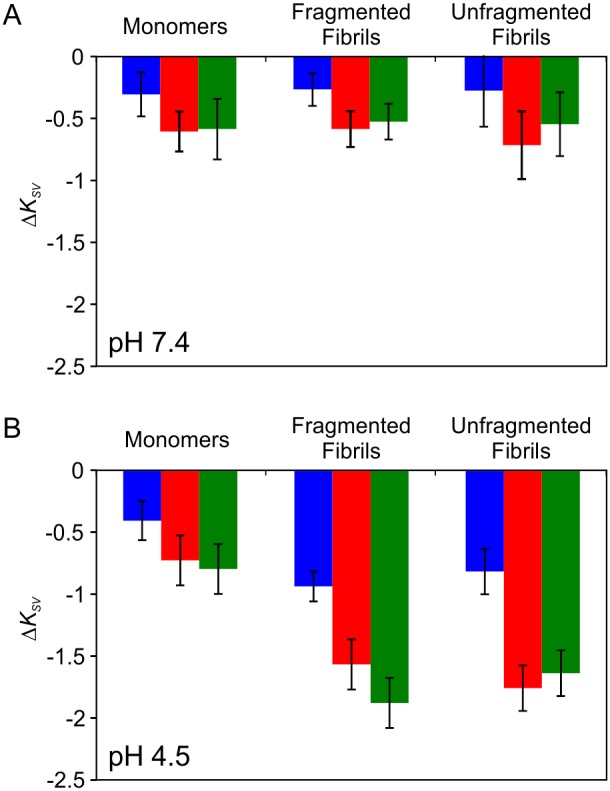
KSV for 6 µM monomer equivalent concentration β2m monomer, fragmented or unfragmented fibrils 10 min after addition of LUVs (5 µM lipid) at 37°C in (A) Assay buffer at pH 7.4 or (B) Assay buffer at pH 4.5. Lipid mixes comprise 36 POPC: 20 POPE: 7 SM: 25 cholesterol (mol/mol) doped with 0 mol % (blue), 12 mol % (red) or 50 mol % (green) BMP. Error bars represent 1 S.E. from linear regression.