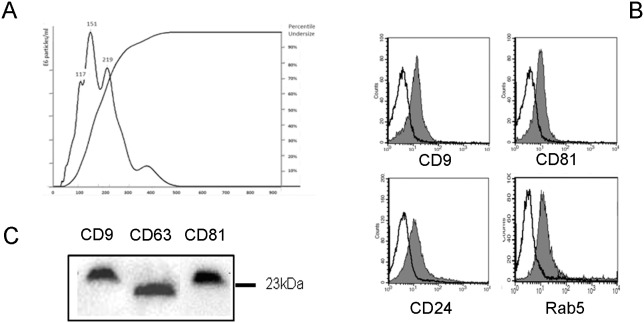
Figure 1. Characterization of normal urinary EVs.
Panel A. NanoSight analysis of samples prepared from the urine of normal subjects showing their size distribution profile. A peak at 151Panel B and C. Representative images of the expression of exosome markers by urinary EVs by cytofluorimetric (B) and Western Blot analysis (C). Cytofluorimetric histograms show marker detection (grey area) and isotypic control (dark line). Five different preparations were tested with similar results.

