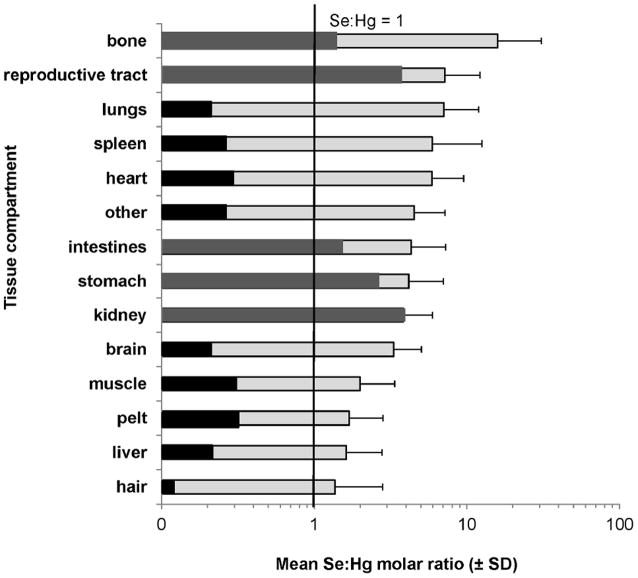
Figure 6.
Mean (± standard deviation) Se:Hg molar ratio in various tissues of 6 Steller sea lion (Eumetopias jubatus) pups (light grey). Se:Hg molar ratios for the case study (dark grey represents tissues above 1 for the pup with the highest [THg]; tissues in black are below 1 for the pup with the highest [THg]) and are included in the mean.

