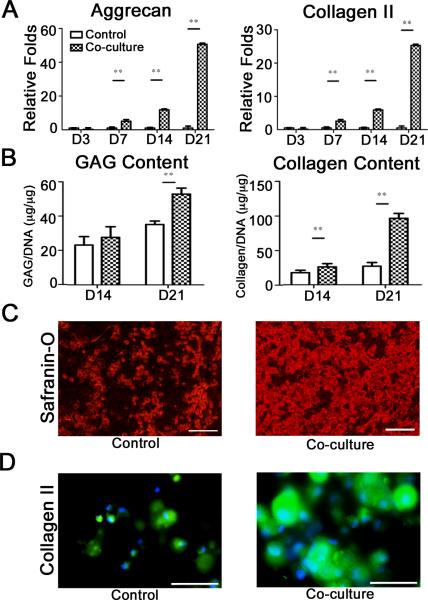
Figure 1.
Chondrogenic differentiation of hMSCs co-cultured with P0 OA chondrocytes. Gene expressions for aggrecan and collagen type II (A) as a function of culture time. Quantification of glycosaminoglycan and collagen content (B) normalized to DNA. Safranin-O for control and co-culture (C) and collagen II for control and co-culture (D) staining after 21 days of culture, indicating cartilage tissue formation. Scale bar: 100 μm.

