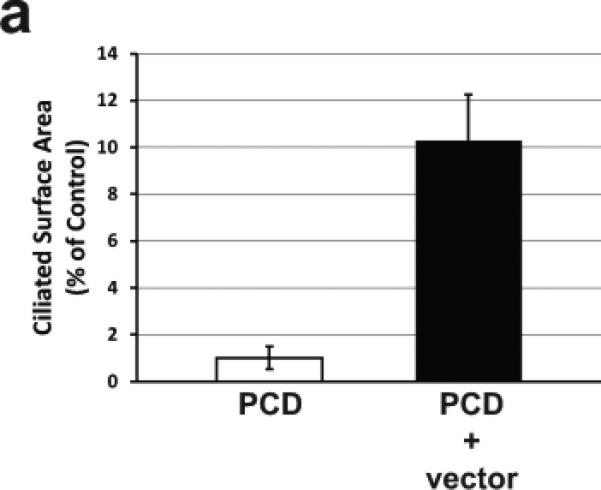
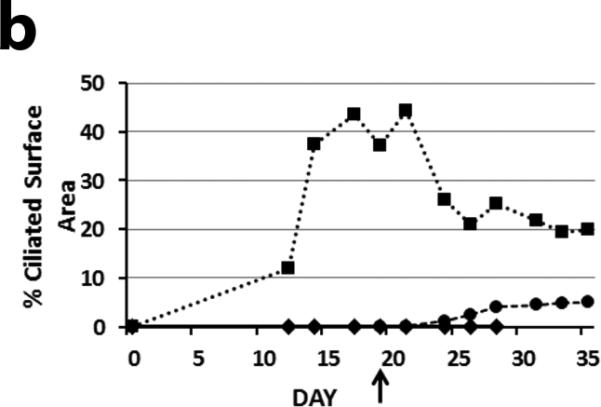
Figure 3.


a) Ciliary activity as a percentage of surface area in PCD cultures and differentiated PCD cultures transduced apically with a lentiviral vector expressing Dnaic1. Data are expressed as the percentage of parallel positive control cultures and represents the average ± S.E.M. of 4 separate experiments. b) Same experiment as in 2b showing the increase in ciliary activity vs. time in culture of positive control cells (squares), PCD cells (diamonds) or in differentiated PCD cells transduced apically with the vector (circles). Vector was administered on day 19 (arrow).
