
Fig. 2.
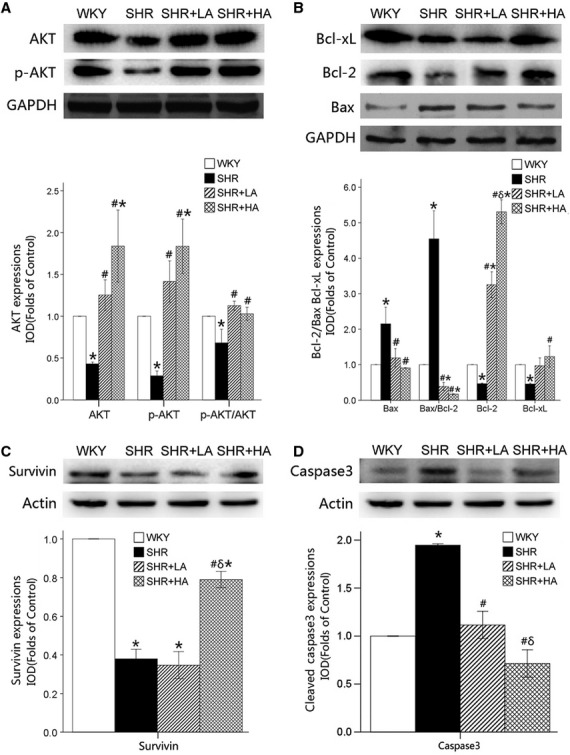
The expression of apoptotic regulatory protein revealed by western blot. (A) The expressions of p-AKT/AKT down-regulated significantly in SHR Controls (P < 0.01), and reversed in SHR+LA and SHR+HA (P < 0.01); (B) the expressions of Bcl-xL significantly suppressed, and the ratio of Bax/Bcl-2 significantly augmented in SHR controls compared with WKY controls (P < 0.01), and reversed in SHR+LA and SHR+HA (P < 0.01); (C) Survivin expression significantly down-regulated in SHR (P < 0.05) and reversed in SHR+HA (P < 0.05); (D) Caspase-3 expression augmented in SHR (P < 0.05) and suppressed in SHR+LA and SHR+HA (P < 0.05). Values, mean ± SEM; n = 3; *P < 0.01 versus WKY controls; #P < 0.01 versus SHR controls; δP < 0.01 versus SHR+LA; WKY: Wistar; SHR: spontaneously hypertensive rats; LA: low dose of Aliskiren; HA: high dose of Aliskiren.