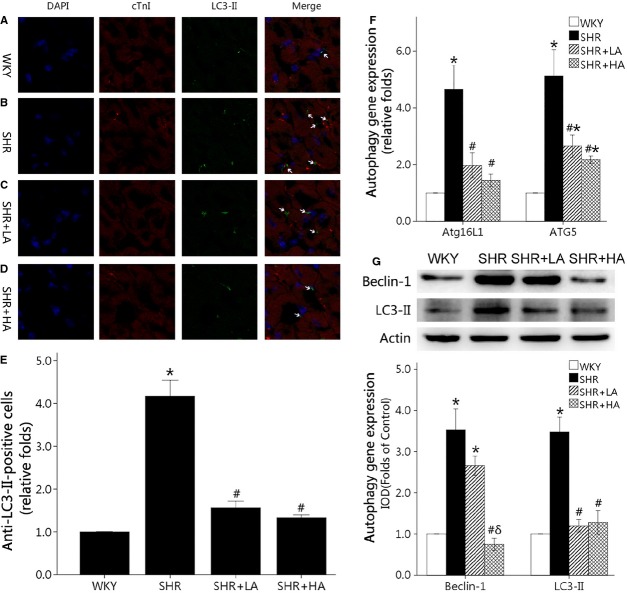
Fig. 3.
Cardiomyocyte autophagy detected by immunofluorescent labelling for LC3-II, western blot and qPCR. (A–D) LC3-II-positive aggregates in the representative immunofluorescent staining of WKY controls, SHR controls, SHR+LA and SHR+HA; (E) quantitative analysis of LC3-II-positive aggregates in the four groups and normalized to the WKY controls; (F) SHR controls showing significantly higher Atg5 and Atg16L1 expressions of mRNA than WKY ones (P < 0.01), and down-regulated in SHR+LA and SHR+HA (P < 0.01); (G) the expressions of Beclin-1 and LC3-II down-regulated significantly in SHR Controls (P < 0.01), and reversed in SHR+HA (P < 0.01). Values, mean ± SEM; n = 4; *P < 0.01 versus WKY controls; #P < 0.01 versus SHR controls; arrow indicating a LC3-II-positive aggregates; WKY: Wistar; SHR: spontaneously hypertensive rats; LA: low dose of Aliskiren; HA: high dose of Aliskiren.

