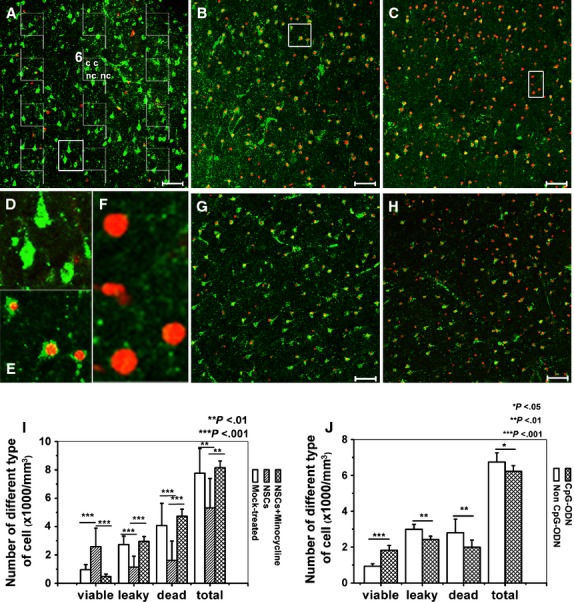
Fig. 2.

Representative images and quantification of different types of cells in adult mouse brain slices by using Live/Dead staining kit. The slices were stained by using Live/Dead kit as given in the Material and methods section. ‘Viable cells’ were defined as those that contained a green fluorescent cytoplasm and a dark nucleus, whereas cells with a red nucleus only were counted as ‘dead cells’, and cells that had a red nucleus with green cytoplasm, and were consequently in an intermediate state between viable and dead, were denoted as ‘leaky cells’. In each image, the cells were counted by using 12 counting quadrants containing inclusion and exclusion lines as shown in (A). Each counting field has an inclusion line (dashed) and an exclusion line (continuous). Any cell whose nucleus is in the frame without touching or crossing the exclusion line is counted. If a nucleus is touching or crossing the inclusion line, it is counted. For example, in field 6, two viable cells are counted (c), two viable cells are not counted (nc; if a cell profile is too vague, we choose to ignore it). (A) The slices co-cultured with neural stem cells (NSCs). (B) The mock-treated slices. (C) The minocycline-treated NSCs co-cultured slices. (D) The magnified image shows the viable cells outlined in (A). (E) The magnified image shows the leaky cells outlined in (B). (F) The magnified image shows the dead cells outlined in (C). (G) The CpG-ODN-treated slices. (H) The non-CpG-ODN-treated slices. (I) Quantification of different types of cells in the brain slices cultured for 3 days. (J) Quantification of different types of cell number in the brain slices treated with CpG-ODN or non-CpG-ODN. Results are shown as means ± SD (n = 16).
