Fig. 3.

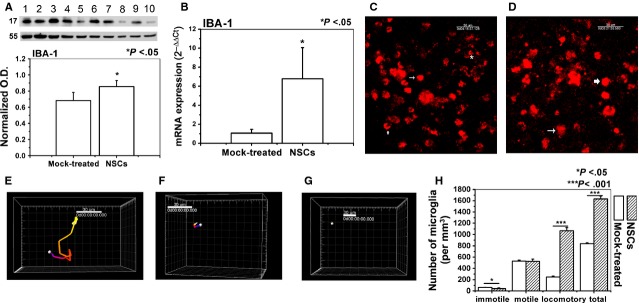
Neural stem cells (NSCs) induced the microglial activation in the brain slices. IBA-1 was used as a marker of activated microglia. (A) IBA-1 protein level in the slices. (lanes 1, 3, 5, 7 and 9, NSCs-treated group; lanes 2, 4, 6, 8 and 10, mock-treated group). (B) IBA-1 mRNA expression level in the slices. (C) Time-lapse images of microglia movement in the slices co-cultured with NSCs. (D) Time-lapse images of microglia movement in the slices from the mock-treated group. (E) The surpass image represents the cell (overstriking arrowed and arrowed in C), and the trajectory shows that it has large-scale movement. (F) The surpass image represents the cell (asterisk in C and overstriking arrowed in D), and the trajectory shows that the movement ability was limited. (G) The surpass image represents the cell (arrowed in D), and the trajectory shows its pseudopods keeping stretching out and retracting while the cell body does not move. (H) Quantitative analysis of microglia motility in the adult brain slices from the NSCs and the mock-treated group. Results are shown as means ± SD (n = 5).
