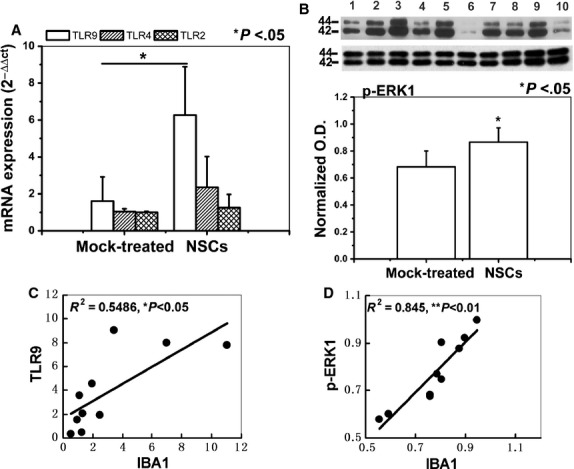
Fig. 5.

Neural stem cells (NSCs) induced microglial activation via TLR9 and ERK1/2. (A) The real-time PCR analysis of the TLR9, TLR2 and TLR4 mRNA expression level in the slices co-cultured with or without NSCs. (B) p-ERK1 phosphorylation level in the slices. (lanes 1, 3, 5, 7 and 9, NSCs-treated group; lanes 2, 4, 6, 8 and 10, mock-treated group). (C) TLR9 mRNA level positively correlated with IBA-1 mRNA level. (D) p-ERK1 protein level positively correlated with IBA-1 protein level. Results are shown as means ± SD (n = 5).
