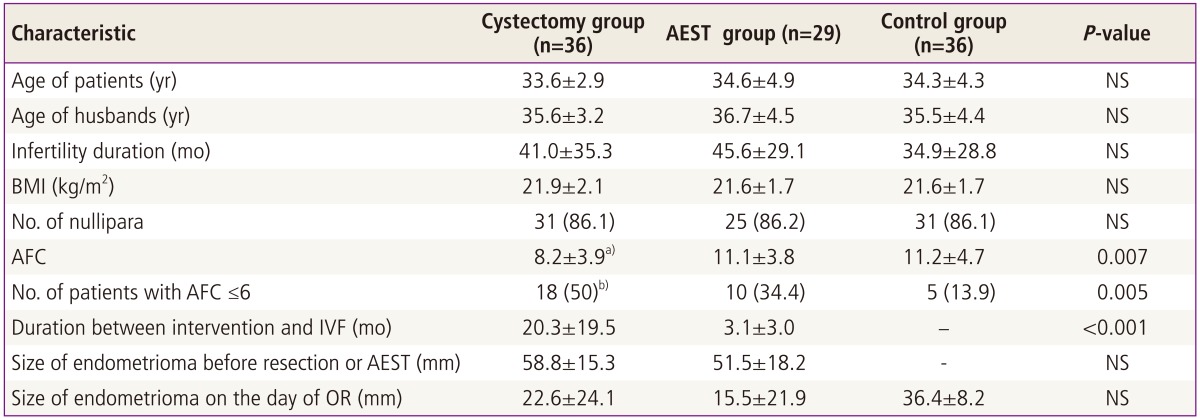
Table 1.
Patients' characteristics

Values are presented as mean±standard deviation or number (%).
AEST, aspiration and ethanol sclerotherapy; NS, not significant; BMI, body mass index; AFC, antral follicle count; OR, oocyte retrieval; IVF, in vitro fertilization.
a)Significantly lower than in the aspiration or control group (P=0.024, P=0.017, respectively); b)Significantly higher than in the aspiration or control group (P=0.005, P=0.005).
