
Table 2.
Comparison of controlled ovarian stimulation results and in vitro fertilization/intracytoplasmic sperm injection outcome
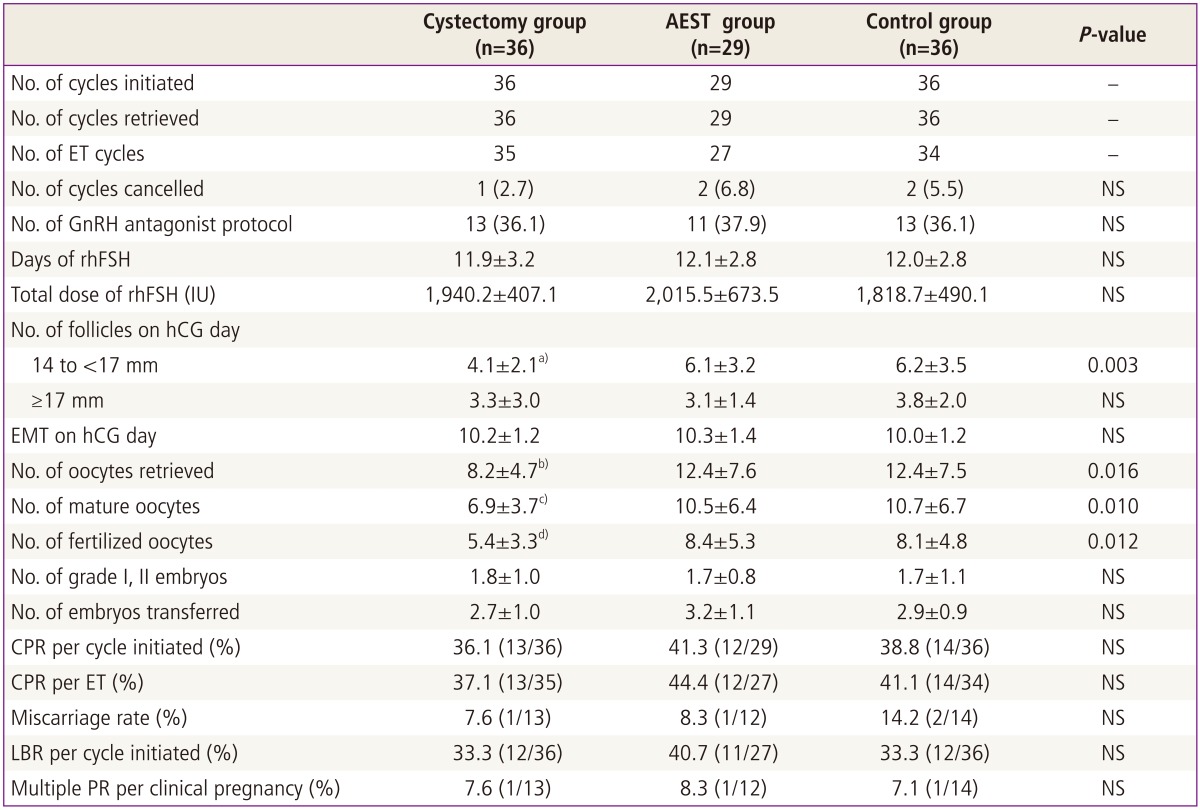
Values are presented as mean±standard deviation or number (%) unless otherwise indicated.
AEST, aspiration and ethanol sclerotherapy; ET, embryo transfer; NS, not significant; GnRH, gonadotropin releasing hormone; rhFSH, recombinant human follicle stimulating hormone; hCG, human chorionic gonadotropin; EMT, endometrial thickness; CPR, clinical pregnancy rate; LBR, live birth rate; PR, pregnancy rate.
a)Significantly lower than in the aspiration or control group (P=0.017, P=0.008, respectively); b)Significantly lower than in the aspiration or control group (P=0.05, P=0.031, respectively); c)Significantly lower than in the aspiration or control group (P=0.042, P=0.018, respectively); d)Significantly lower than in the aspiration or control group (P=0.028, P=0.037, respectively).