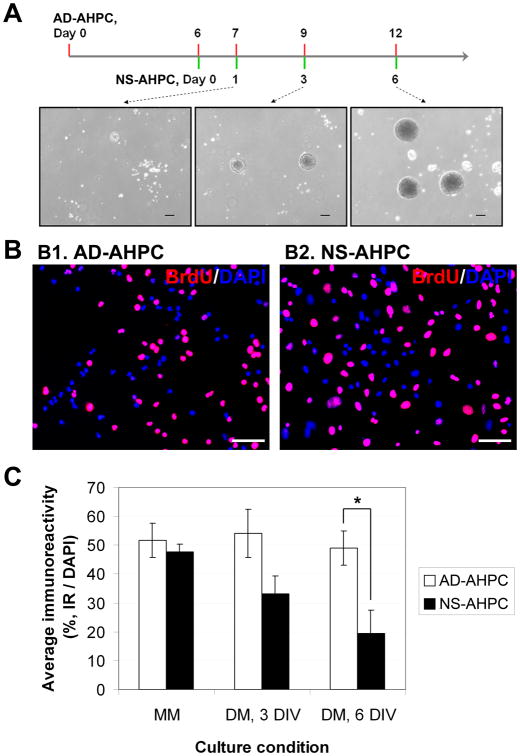
Figure 1.
Comparison of proliferating capacity of AHPCs, adherent and neurosphere. (A) Schematic time-line for generation of AHPC neurospheres. (B) Representative images of BrdU-incorporating adherent AHPCs (B1) and AHPCs in neurospheres (B2). (C) Quantitative data representing average percentage of BrdU-incorporating cells under proliferating or differentiating culture condition. N (number of independent experiments) = 3∼5. Scale bars in A, 200 μm; in B, 50 μm.

