Figure 3.
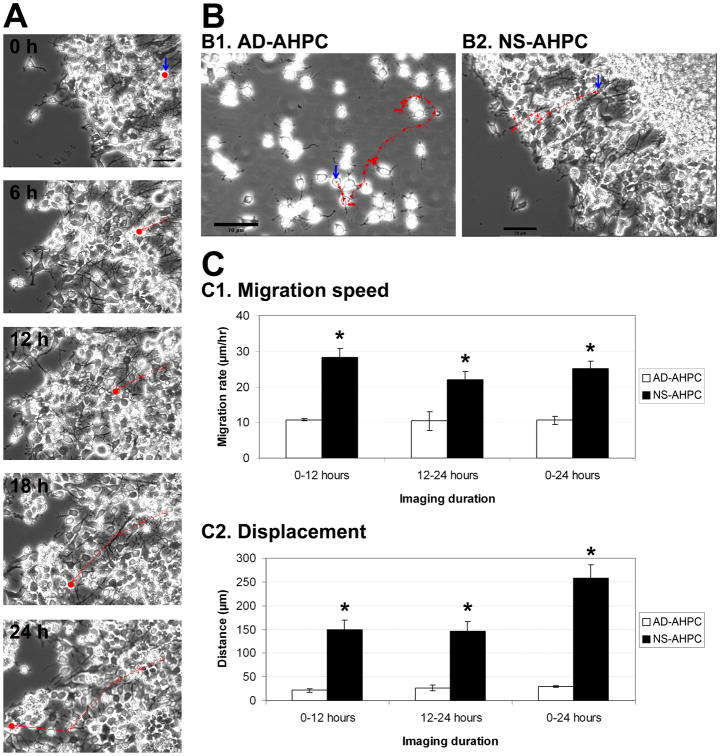
Comparison of migrating properties of AHPCs, adherent and neurosphere. (A) Sample image frames of a single cell in the same microscopic field from a time-lapse series at 0, 6, 12, 18 and 24 hours. The solid red dot in each image represents the position of the cell at the time indicated. The solid red line shows migration that occurred during the 6-hour interval. The dotted red line indicates migration accumulated from previous intervals. (B) Representative images of an adherent AHPC (B1) and an AHPC from a neurosphere (B2) traced to examine the migration rate. The red arrows represent the migrating path of a single AHPC for a 24-hour period; each individual arrow represents migrational movement during a 2-hour time period. (C) Quantitative data illustrating average migration speed (C1) and average displacement (C2) for AHPCs from neurospheres compared to adherent AHPCs. Three independent experiments were performed; 20∼25 cells per cell type were analyzed from each experimental session. Blue arrows in A and B indicate the initial position of a single cell (at 0 h for time-lapse imaging) traced for total 24 hours. Scale bars in A, 50 μm; in B, 70 μm. Asterisks indicate significant differences in comparison of NS-AHPC to AD-AHPC.

