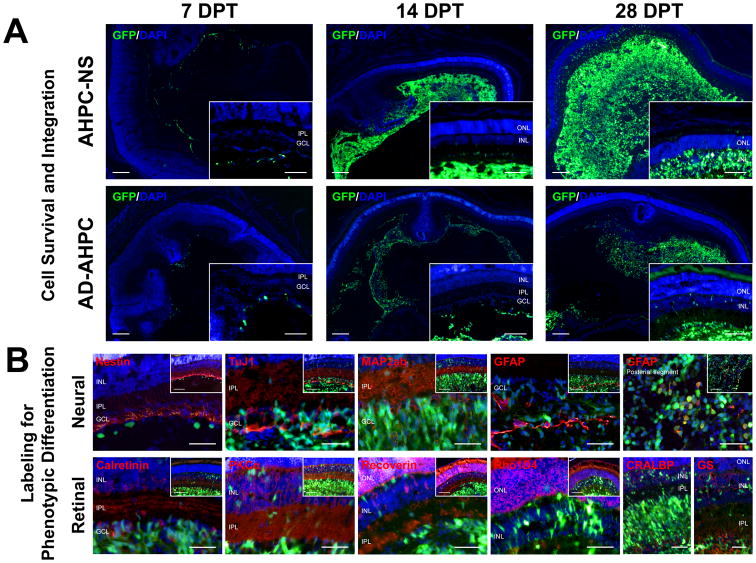
Figure 4.
Representative images of retinal sections following transplantation. (A) Cell survival and integration are shown at 7, 14, and 28 days post-transplant (DPT) for both NS-AHPC and AD-AHPC populations. General presence of AHPCs was increased from 7 to 28 DPT. Scale bars, 100 μm. (B) Images for phenotypic labeling were from NS-AHPC populations at 14 and 28 DPT. Scale bars, 50 μm; 100 μm in insets.

