
Figure 1.
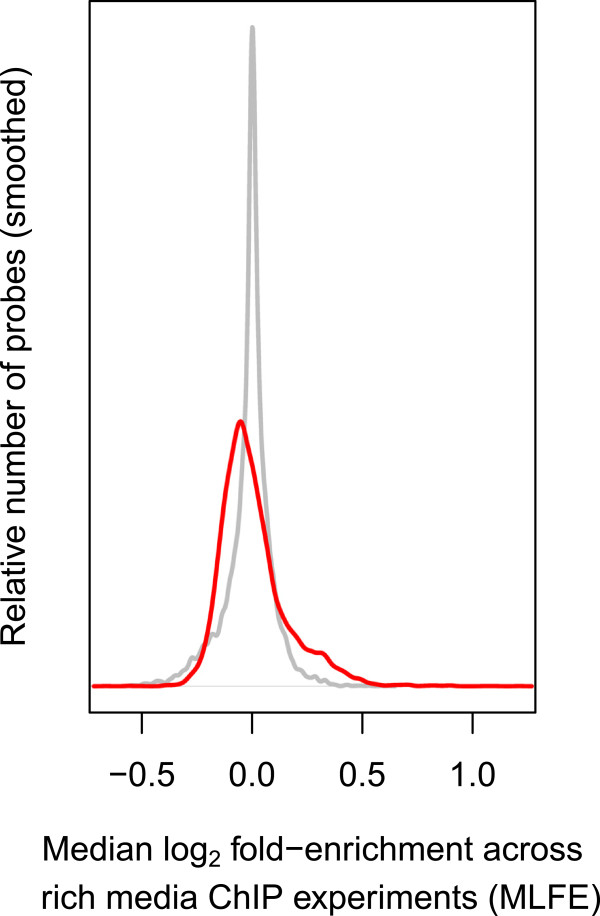
ChIP co-enrichment. Distribution of TF ChIP co-enrichment across probes. Co-enrichment is quantified as median log2 fold enrichment (MLFE) across all analyzed rich media experiments from Harbison et al. [11]. The distribution of the original normalized published data is in gray, and the distribution of the reanalyzed data is in red.