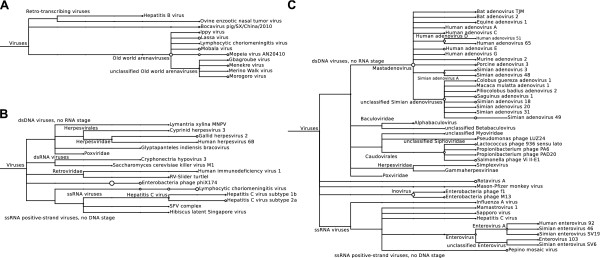
Figure 3.

Taxonomic identification using the LCA with BLASTN-NT. The taxonomic trees for (A) rodent, (B) reptile and (C) simian samples. The circle sizes indicate the relative numbers of assigned reads. These trees were created using MEGAN [8]. Here, only the viral taxa are illustrated.
