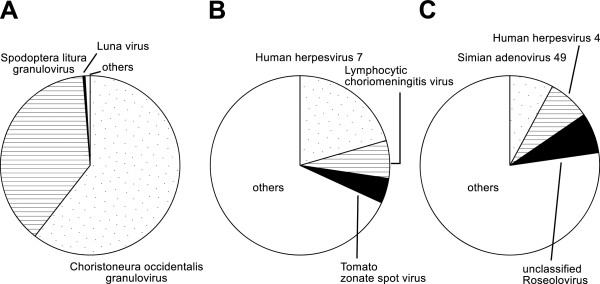
Figure 4.

Taxonomic classification using the LCA with BLASTN viruses. The pie charts illustrate the number of reads assigned to taxa for (A) the rodent sample at the 6th taxonomic level, (B) the reptile sample at the 7th taxonomic level and (C) the simian sample at the 7th taxonomic level. Here, only the top three taxa are denoted.
