
Figure 1.
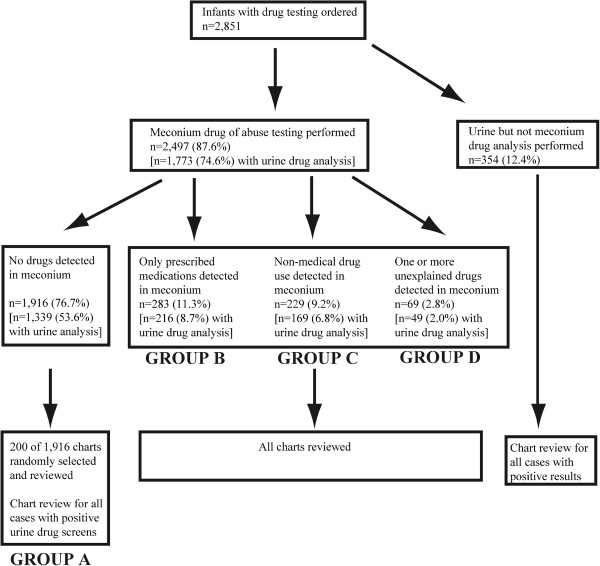
Flow diagram of the study population categorized by results of meconium and urine drug testing. The designation of Groups A, B, C, and D are described in detail in the Methods section.
Official websites use .gov
A
.gov website belongs to an official
government organization in the United States.
Secure .gov websites use HTTPS
A lock (
) or https:// means you've safely
connected to the .gov website. Share sensitive
information only on official, secure websites.
Flow diagram of the study population categorized by results of meconium and urine drug testing. The designation of Groups A, B, C, and D are described in detail in the Methods section.