
Figure 1.
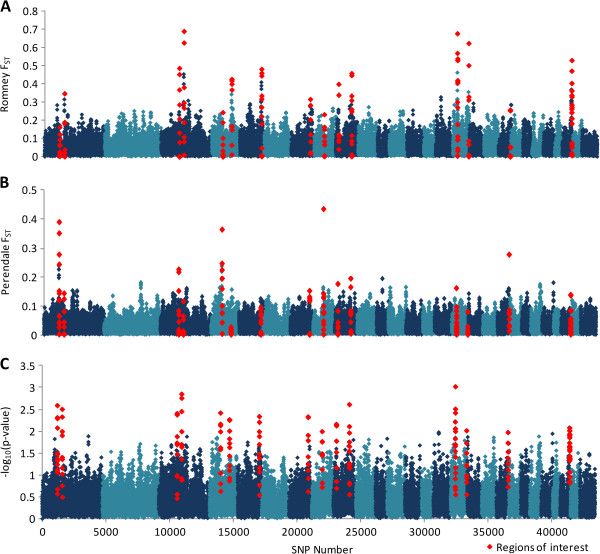
Genome wide signatures of selection. A moving window of 5 FST values between the resistant and susceptible Romney (A) and Perendale (B) lines. (C) A moving average (of 5 SNP) showing the one-tailed probability of the chi-squared distribution of the combined Romney and Perendale Peddrift P-values. Results are expressed as -logl0 (significance probability). Regions of interest as defined by WIN5 –log10 (combined Peddrift P-values) (Table 1) are shown in red.