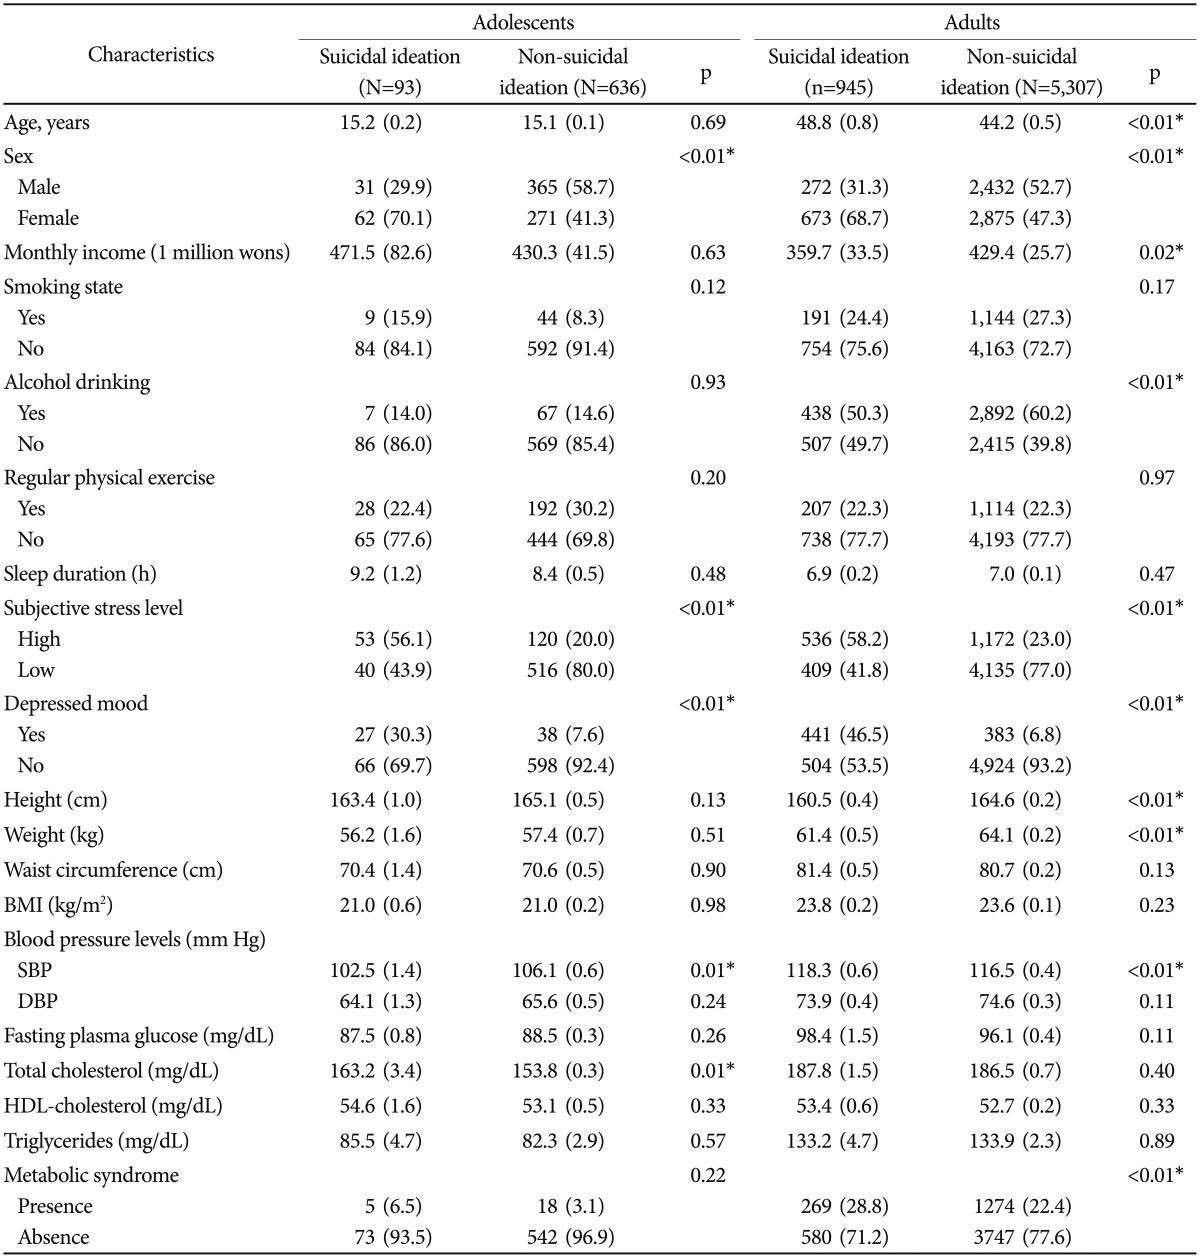
Table 2.
Comparison of characteristics between suicidal ideation cases and non-cases between Korean Adolescents and adults in the Korean National Health and Nutrition Examination Survey 2010 (N=7004)

Values are presented as unweighted n (weighted %) or as the mean (standard error). The sum of the adolescents and adults in the subgroup does not equal the total number of participants in this study because information was not available for a few participants. p values were obtained by general linear model or chi-square test, *p<0.05. BMI: body mass index, SBP: systolic blood pressure, DBP: diastolic blood pressure, HDL: high density lipoprotein
