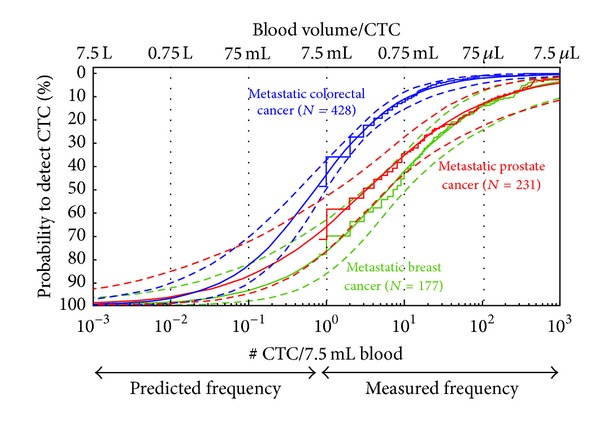
Figure 3.

Frequency of CTC in metastatic colorectal prostate and breast cancer. Frequency was measured in 7.5 mL of blood (right half of the figure) and predicted in larger blood volumes (left half of the figure). Extrapolation of number of CTC was performed by a log-logistic function (solid line) including 95% confidence interval (dashed lines) and fitted through the empirical cumulative distribution functions (stair plots) for metastatic breast, colon, and prostate cancer. The fitted curve shows the blood volume that is needed (7.5 L) to detect the presence of CTC in all patients (100% probability) in a metastatic setting, using the CellSearch approach. Adapted figure from [46].
