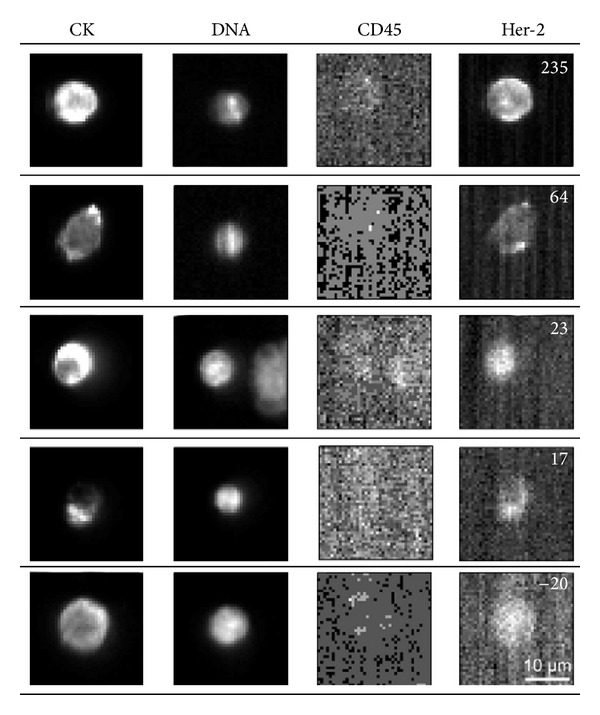
Figure 6.

Example of five CTC from five different patients. Fluorescence of CTC Her-2 expression (right column) is quantified by the number in upper right corner. A higher positive number represents a higher Her-2 expression, whereas a negative number (bottom picture) represents no Her-2 expression on that CTC. The scale bar is applied to all images. Adapted figure from [24].
