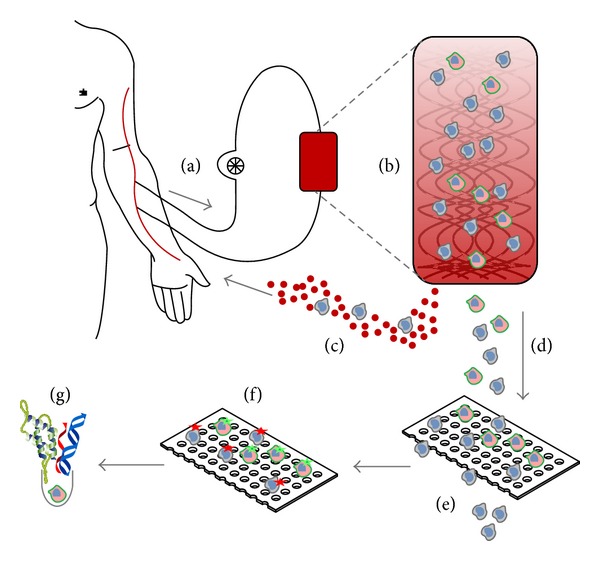
Figure 7.

Schematic representation of the CTCTrap. Blood from a patient (a) is passed through a functionalized 3D matrix (b). The porous matrix can withstand up to 5 L of blood flow. In this matrix are one or more specific antibodies present for CTC capture. A continuous blood flow without cells of interest is circled back to the patient (c). Retained cells are eluted from the matrix (d) and will be filtered through 1–5 µm pores to reduce hematopoietic background (e). Cells retained on the filter can be used for immunofluorescent staining to discriminate CTC from non-CTC (f) and subsequently be used for isolation of single CTC for additional molecular characterization, like protein, RNA, and DNA analysis (g).
