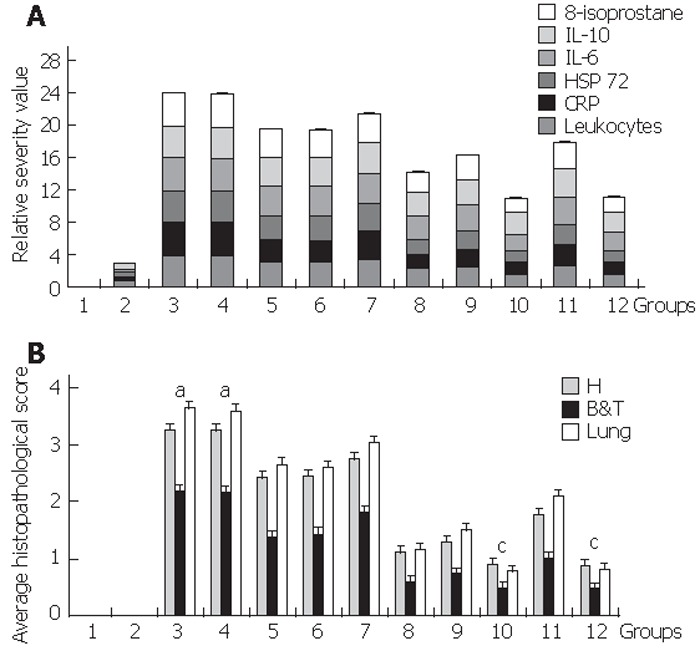
Figure 2.

Relative severity value in blood and average histopathological score. A: Relative severity value in blood. To visualize the severity degree based on biochemical assays in blood, we arbitrarily established a single “relative severity value” of zero to group 1 (reference baseline value) and of four to group 3 (AP) per assay. To calculate the single “relative severity value” for the rest of the groups we used the following formula: “relative severity value” = [( X – reference baseline value) / ( AP value – reference baseline value )] x 4. Introducing each mean value from table 2 (referred to in the above formula as X) we obtained six different single “relative severity values” for each group, whose contribution to the total “relative severity value” is shown in this graph. For those values in table 2 that were below the detection limit, the value assigned to X corresponded to that of the assay’s sensitivity (IL-6: 112 pg/mL; IL-10: 12 pg/mL). Homogenous Groups are 1-2-(12-10)-8-9-11-(5-6-7)-(3-4), P<0.05. Results are shown as mean ± SD. B: Average histopathological score. To visualize the severity degree based on the score-associated to histopathological lesions, we averaged the means of the six parameters used in table 4 for each group. Homogenous groups are 1-2-(12-10)-8-9-11-(5-6-7)-(3-4), P < 0.05. There was a significant increase in the assessed parameters for Groups 3&4 that developed severe AP aP < 0.03 while groups 10& 12 exhibited a significant improvement cP < 0.05 Results shown as mean ± SD.
