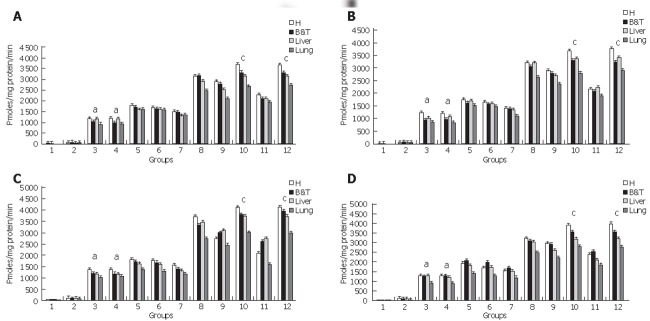
Figure 3.

Caspase Activities. A: Caspase 2 activity was measured to evaluate the upstream activation of the intrinsic apoptotic pathway. Groups 10&12 presented a significant activation cP < 0.05 which was reduced for groups 3&4 aP < 0.05. Homogenous groups for caspase 2 activity are: 1-2-(12-10)-8-9-11-(5-6-7)-(3-4), P < 0.05. H: pancreatic head, B&T: pancreatic body and tail. B: Caspase 3 Activity was measured to evaluate the activation of the executor caspase 3. Groups 10&12 presented a significant activation cP < 0.05 which was reduced for groups 3&4 aP < 0.05. Homogenous groups for caspase 2 activity are: 1-2-(12-10)-8-9-11-(5-6-7)-(3-4), P < 0.05. H: pancreatic head, B&T: pancreatic body and tail. C: Caspase 8 Activity was measured to evaluate the activation of the initiator caspase 8. groups 10&12 presented a significant activation cP < 0.05 which was reduced for groups 3&4 aP < 0.05. Homogenous groups for caspase 8 activity are: 1-2-(12-10)-8-9-11-(5-6-7)-(3-4), P < 0.05. H: pancreatic head, B&T: pancreatic body and tail. Results shown as mean ± SD. D: Caspase 9 Activity was measured to evaluate the activation of the intrinsic pathway .Groups 10&12 presented a significant activation cP < 0.05 which was reduced for groups 3&4 aP < 0.05. Homogenous groups for caspase 9 activity are: 1-2-(12-10)-8-9-11-(5-6-7)-(3-4), P < 0.05. H: pancreatic head, B&T: pancreatic body and tail. Results are shown as mean ± SD.
