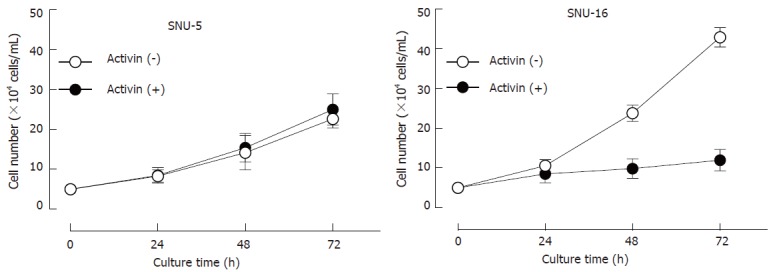
Figure 1.

Effects of activin A on cell viability in SNU-5 and SNU-16 cells. Cells (5 × 10⁴ cells/mL) were cultured with activin A (100 ng/mL) in a time-dependent manner and viable cells were counted with a hemocytometer. Values are the mean ± SD of three individual experiments. bP < 0.01 vs the control values.
