
Figure 2.
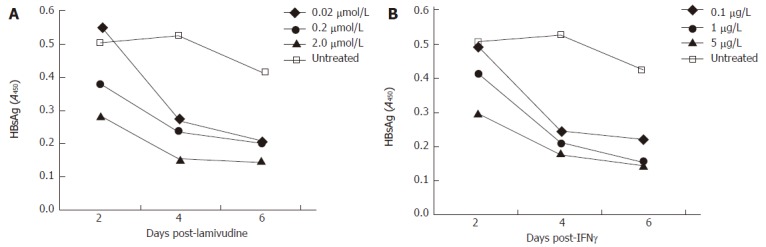
A time course HBsAg profile (ELISA) of transduced HepG2 cells, treated with variable doses of lamivudine and IFN-γ. A: Effect of lamivudine used at concentrations of 0.02, 0.2, and 2.0 μmol/L; B: Effect of IFN-γ used at concentrations of 0.1, 1.0 and 5.0 μg/L.