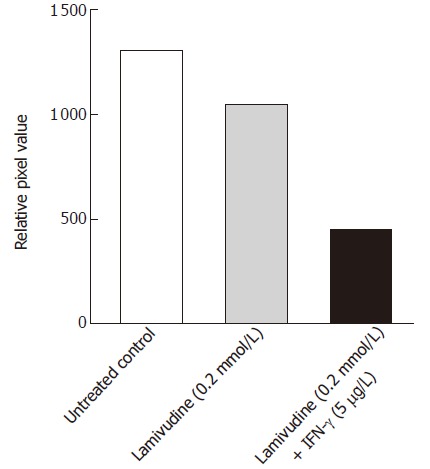
Figure 6.

Effect of sequential treatment with “high-dose” of Lamivudine and IFN-γon HBV cccDNA pool in transduced HepG2 cells. The figure shows densitometric analysis of the 2 kb cccDNA form. 1: Untreated control; 2: Lamivudine (0.2 μmol/L) 8 d; 3: Lamivudine (0.2 μmol/L) 2 d + IFN-γ (5.0 μg/L) 6 d.
