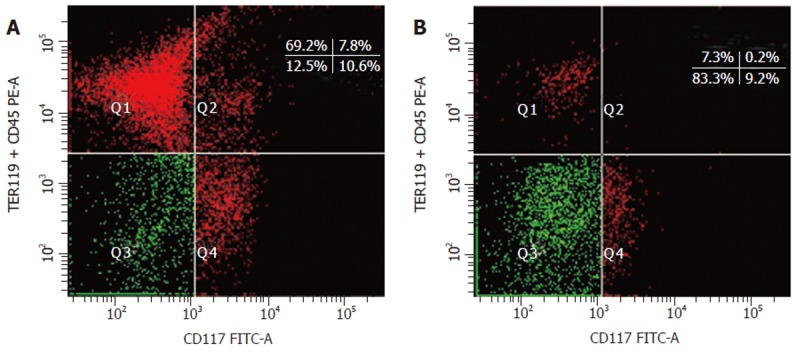
Figure 1.

Flow cytometric fractionation and sorting of fetal mouse liver cells. A: Two-color FACS analysis of ED 12 mouse fetal liver cells by FACSAria. A mixture of biotinylated anti-CD45.2 and anti-TER119 mAb versus FITC anti-CD117 mAb defined the four populations of the dot plot. B: Re-analysis of the sorted Q3 cells.
