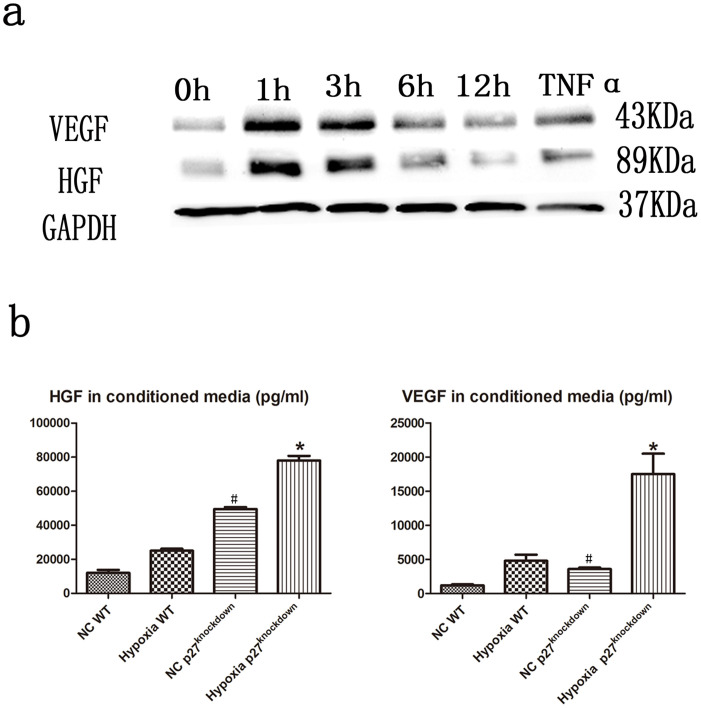
Figure 3. VEGF and HGF expression in H9c2 cells exposed to treatment with hypoxia or TNF-α.
H9c2 cells were seeded in six-well plates and then treated with hypoxia for 0, 1, 3, 6, or 12 h or with 10 ng/ml TNF-α for 2 h. (a) Representative immunoblots of VEGF and HGF in H9c2 cells treated for various times with hypoxia or with TNF-α, according to its 45 KD molecular weight, the up-regulated VEGF-A165 was confirmed. (b) VEGF and HGF levels assayed using ELISA in conditioned media. * p < 0.05 compared with the negative control (NC) WT group (n = 3).

