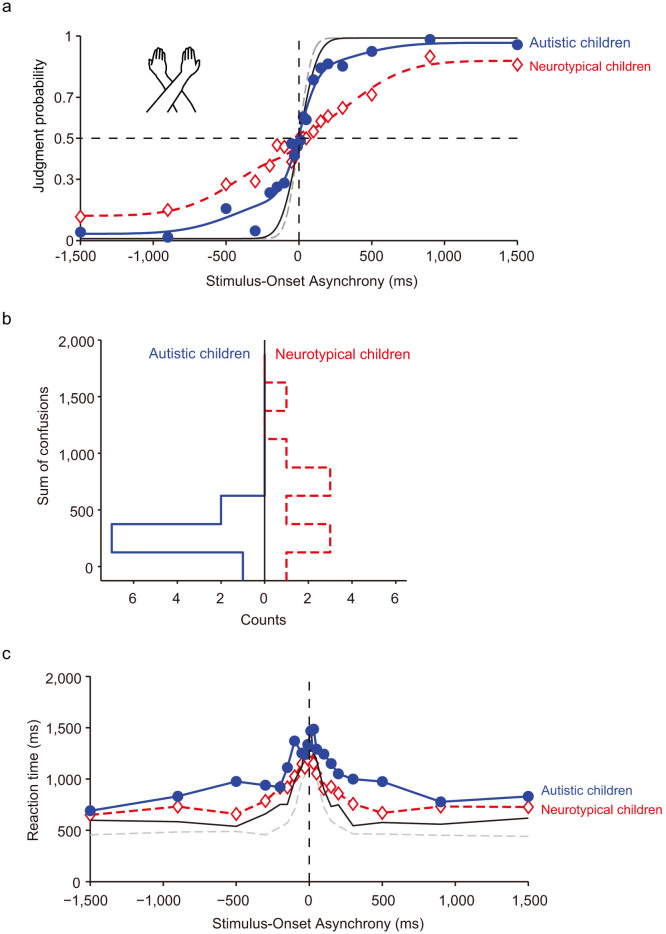
Figure 3. Tactile TOJs under the arms-crossed condition.
(a) Judgment probabilities for autistic (blue solid circles) and neurotypical (red open diamonds) children. Judgment probabilities under the arms-uncrossed condition are also displayed (same data as in Fig. 1). Each symbol represents the average of the 60 judgments made by the 10 autistic participants and the 60 judgments made by the 10 neurotypical participants. (b) Distribution of the sums of confusion (SC) in autistic (blue line) and neurotypical (red line) children. Notice that the SCs were smaller in autistic than in neurotypical children. (c) RTs of autistic and neurotypical children. RTs under the arms-uncrossed condition are also displayed (same data as in Fig. 1). The drawings of arms were drawn by W.M.

