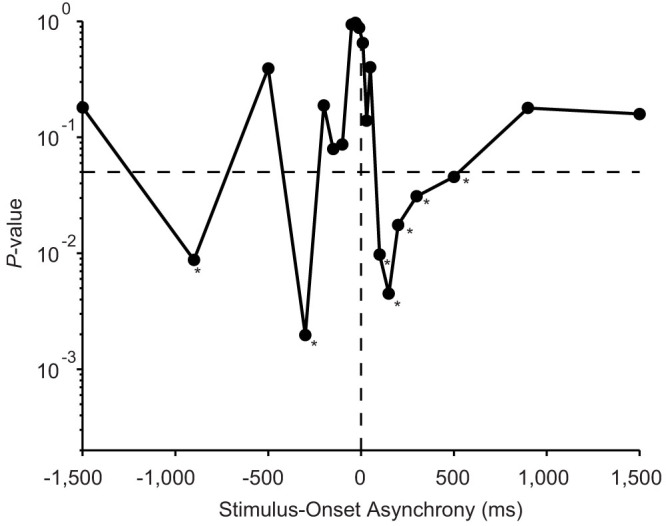
Figure 4. Difference between autistic (n = 10) and neurotypical (n = 10) children in the judgment probability at each SOA under the arms-crossed condition.

The P-value (ordinate) is plotted as a function of the SOA (abscissa).

The P-value (ordinate) is plotted as a function of the SOA (abscissa).