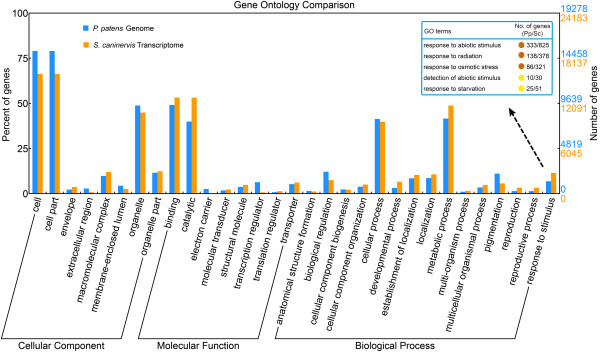
Figure 4.

Gene ontology classification and comparison between the mosses P. patens and S. caninervis. Gene ontology annotation results of the genes from the P. patens genome and S. caninervis transcriptome were mapped to categories within the second level of GO terms. GO terms that contain more than 1% of total genes were included in this graph. Abiotic stress related subcategories of the term “response to stimulus” were shown in the box.
