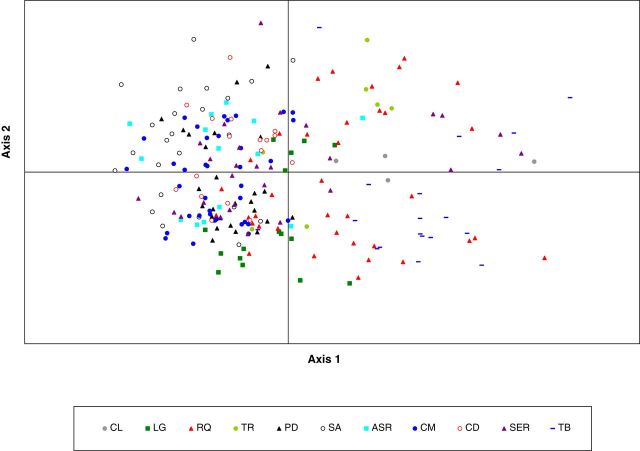
Figure 3.
Two-dimensional representation of the first two axes of the principal component analysis from the matrix of genetic distances of 230 samples from 11 populations. Percentage of variance accumulates on the first two axes = 44.46 % (Axis 1 = 23.82 %; Axis 2 = 20.34 %). For population names see Table 1.

