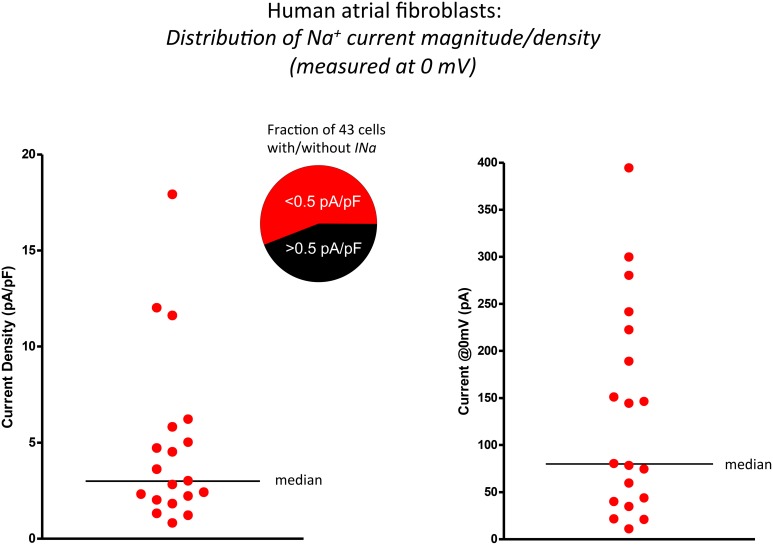
Figure 2.
Scatter plots illustrating the significant range of values of functional Na+ current expression in isolated human atrial myofibroblasts (n = 19 cells). The data in the left panel summarizes these findings as current densities, i.e., by expressing INa values (recorded in response to depolarization to 0 mV) normalized for cell (myofibroblast) capacitance (mean ± s.e.m.; 30.8 ± 4.9 pF). The same data set is presented in the right panel as peak INa at 0 mV. Horizontal bars in both plots indicate the median value of each distribution.

